
Summary of Findings
- Does the Pareto distribution really predict a 2x crash point twice as often? Not in the way most players think – we separate statistical illusion from actual probability.
- Why do historical dashboards show clusters of low multipliers? Survivorship bias and small sample sizes create patterns that vanish under the law of large numbers.
- How can you use distribution models like Weibull without falling for false trends? Focus on the mathematical properties of each independent, cryptographically verified round.
- Independence: No sequence of seeds can be predicted to bias toward or away from any multiplier.
- Uniform random distribution of the underlying hash output, which translates into a known probability density for crash points (usually a variant of `1/x` or exponential).
- Verifiability: Players can replay any round using the revealed seeds to confirm the multiplier was not manipulated.
Further reading: Beyond the Hype What Sequence Tracking …

Pareto Distribution and the Myth of a Predictable 2x Frequency
The Pareto distribution (often called the 80/20 rule) describes a power-law relationship where a small percentage of outcomes account for a large share of the total. In crash games, if we map crash multipliers as a continuous random variable, a Pareto tail can approximate the probability of extreme high multipliers (e.g., >10x). However, applying it naively to predict the “real probability of 2x” is misleading. The distribution of crash points is better modeled by an exponential or Weibull family due to the game’s underlying mechanics (e.g., a hash-based multiplicative process). Yet many technical players still search for Pareto-like patterns in historical data.
Further reading: Can a Single 10000x Spike Really Skew A…
Key insight: The probability of hitting exactly 2x (or any multiplier) is determined by the game’s provably fair algorithm – not by fitting a Pareto to a limited sample. The shape parameter of a fitted Weibull distribution often gives a more accurate description of the crash point density near low multipliers. For example, typical crash games have a median multiplier around 1.5x–2x, but the tail drops rapidly. A Pareto distribution with certain parameters would overestimate the frequency of 2x outcomes because it assumes a thicker tail than what actually exists.
| Distribution Model | Typical Shape | Suitability for Crash Points | Common Misuse |
|---|---|---|---|
| Pareto | Power-law tail | Good for very high multipliers (>20x) but poor near the median | Players assume “80% of crashes are below 2x” which is false for most games |
| Weibull | Flexible shape (β, λ) | Excellent fit for full range, especially near low multipliers | Requires parameter estimation from large samples; single-session data often insufficient |
| Exponential | Constant hazard rate | Reasonable for intermediate multipliers (2x–10x) but ignores initial drop | Misses the “hump” seen in real crash distributions |

How Can Historical Dashboards Create False Patterns?
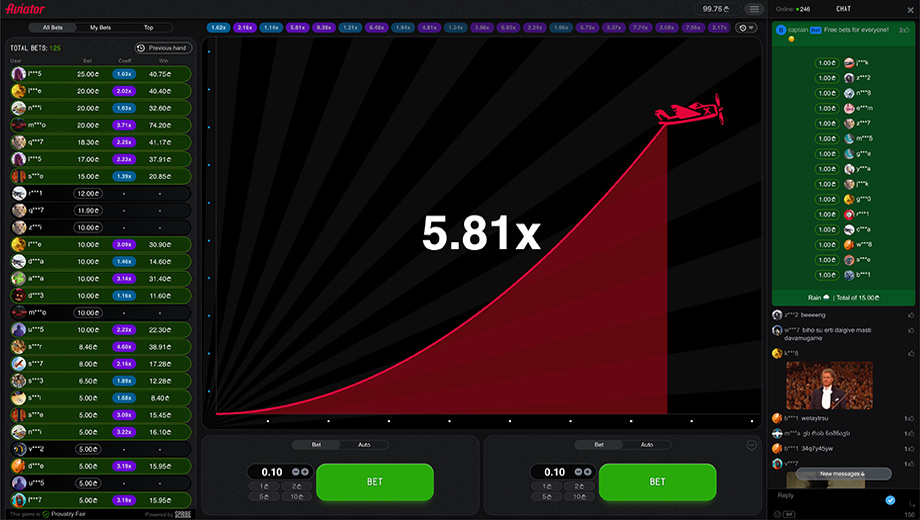
Dashboards that show “most recent 100 crashes” or “frequency of multipliers in the last 500 rounds” are dangerous for inference. They display a selected sample (the most recent history) that may not be representative of the infinite population of rounds. Players often see sequences like four consecutive 1.1x–1.5x crashes and conclude a “trend” – but each round is independent (provably fair with SHA-512). The dashboard also suffers from survivorship bias when the site only shows data from a specific session or user.
Further reading: Aviator Crash Point Transition Probabil…
Correct interpretation: Treat the dashboard as a raw histogram, not a probability forecast. The only reliable long-term pattern is that the overall distribution approaches the theoretical RTP-based curve as the sample size grows (law of large numbers). A single streak of low multipliers does not imply the next crash will be high. In fact, the conditional probability of the next crash being >2x remains unchanged, regardless of past history.
Why Is Provably Fair SHA-512 Critical for Modeling?
Without cryptographic verification, you cannot trust the underlying distribution. Crash games that use SHA-512 (or similar) generate each round’s crash point from a server seed + client seed, hashed and converted to a multiplier via a deterministic function. This ensures:
Further reading: Is Time Series Analysis of Crash Points…
Therefore, any distribution model (Pareto, Weibull, etc.) should be validated against the game’s proven mathematical function – not against dashboard snapshots. The real probability of 2x is baked into the algorithm, not into historical observations.
Can You Use Pareto Distribution to Estimate the “Real” 2x Probability?
Strictly speaking, no – because the true distribution is not Pareto over the full range. However, you can apply Pareto tail approximation for high multipliers (e.g., >10x) to estimate how often extreme events occur. For the probability of ≥2x, a better approach is to compute the cumulative distribution function (CDF) from the game’s official house edge formula. For example, if the game has a 1% house edge, the probability of crashing before 2x is roughly 0.99 / (multiplier) ≈ 0.495, meaning about 49.5% of rounds crash below 2x, and 50.5% reach 2x or higher. This is a direct consequence of the game’s design, not a Pareto fit.
What Are the Most Common Mistakes When Analyzing Crash Histories?
1. Confusing “most frequent multiplier” with “most likely next multiplier.” The mode may be near 1.5x, but the mean and median are different. The probability of the next crash being exactly 1.5x is still a continuous infinitesimal.
2. Using too few data points. Five hundred rounds are enough to see the shape but not to estimate tail probabilities for >10x.
3. Ignoring the house edge. The effective RTP (e.g., 99%) directly shifts the distribution: lower house edge means higher probability of reaching any given multiplier.
4. Believing in “corrections” after a streak of low crashes. The independence of each round means no correction occurs.
FAQ
Q: Is the Pareto distribution a good model for crash game multipliers?
A: Only for the extreme tail (very high multipliers). For the entire range, Weibull or exponential families are more accurate. The Pareto distribution suffers from a shape that doesn’t match the rapid drop near low-to-mid multipliers.
Q: How many historical rounds do I need to reliably estimate probabilities?
A: At least 10,000 rounds to reduce sampling error below 1% for probabilities around 0.5 (e.g., 2x threshold). For tail probabilities (e.g., 10x), 100,000+ rounds are needed.
Q: Does the SHA-512 provably fair system guarantee that historical patterns won’t repeat?
A: It guarantees independence. Patterns in history are random coincidences; they have no predictive value for future rounds.
Q: Can I use the Pareto principle to say “80% of crashes are under 2x”?
A: No. That would be true only if the crash distribution were exactly Pareto with a specific shape, which it isn’t. In typical crash games, the actual percentage of crashes below 2x is around 50–60%.
Q: What is the real 2x probability according to the game’s algorithm?
A: For a crash game with X% house edge, the probability of reaching at least 2x is (100 – house edge) / 100 * (1 / 2) = (RTP) / 2. For a 99% RTP game, that’s 49.5% reaching 2x or higher (and 50.5% crashing before 2x). The distribution is continuous, so the exact point probability of exactly 2x is zero.