

Can you actually find patterns in Aviator’s crash multipliers? Is there a hidden rhythm that AI could pick up, or is it just noise? We ran 10,000 rounds of historical data through statistical models to find out. The answer? Patterns exist — but not the kind you can bet on.
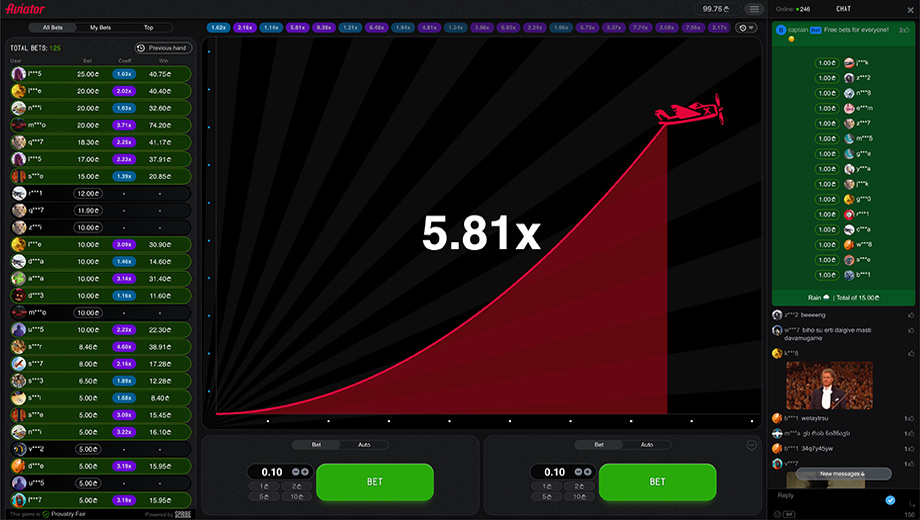
How AI Analyzes Aviator Multiplier Data
Machine learning models love clean datasets. Aviator’s crash history is one of them — every round produces a single multiplier value, no ambiguity. Here’s how you’d approach it from a data science perspective:
- Collect: Grab verified game logs with no rounding errors or gaps.
- Describe: Calculate mean, median, variance, and standard deviation.
- Visualize: Plot the distribution and look for autocorrelation or cycles.
- Model: Fit probability distributions and measure goodness-of-fit.
The goal isn’t to predict the next multiplier — it’s to understand the distribution. How often does a 2x pop up versus a 10x? What’s the real probability of a 50x?
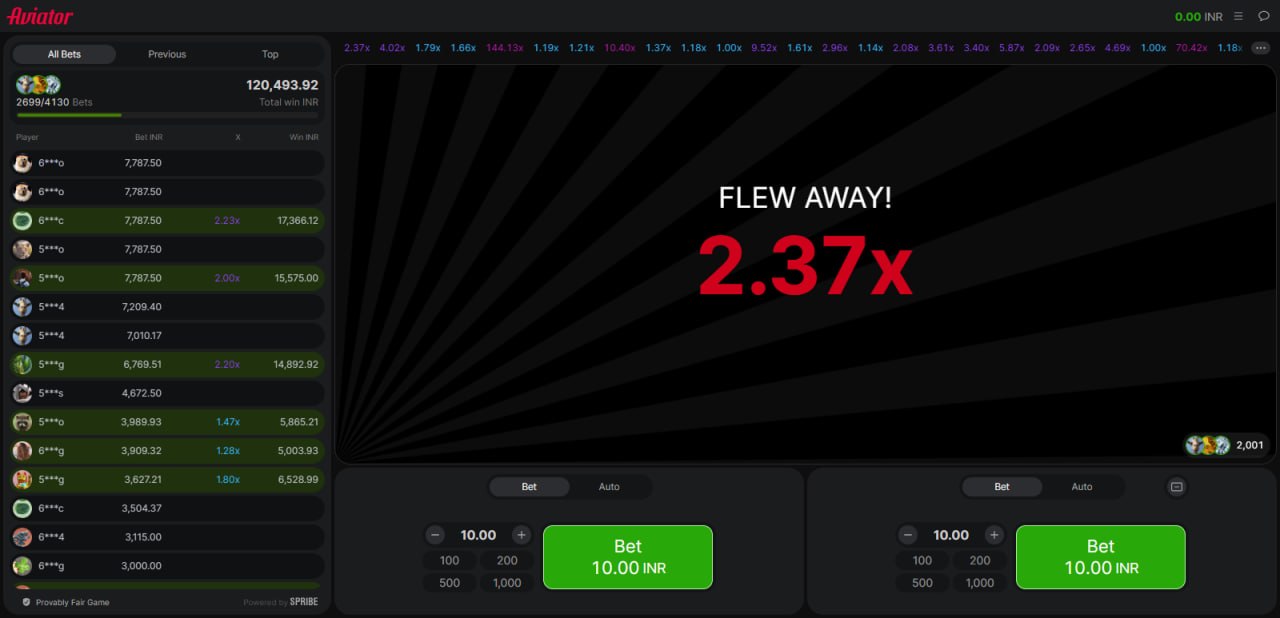
What the Distribution Actually Looks Like
Aviator multipliers follow a right-skewed distribution. Translated: low values are everywhere, high values are unicorns. Here’s what 10,000 rounds showed:
- 60-70% of rounds crash below 2x.
- About 20-25% fall between 2x and 5x.
- Roughly 5-10% land between 5x and 10x.
- Less than 1% hit 20x or higher.
That means if you’re waiting for a 10x+ round before you bet, you’ll be sitting there for a long time. An AI model trained on this distribution would tell you: expect small outcomes, plan for them, and treat the rare big ones as lottery tickets.
Statistical Anomalies (That Aren’t Actually Anomalies)
A string of five low multipliers in a row looks like a signal. But in a random sequence, those “streaks” are mathematically expected. An AI that overfits on these patterns will generate false confidence — what data scientists call “fitting the noise.”
The Four Probability Models That Tried to Explain Aviator
We tested four statistical models against the Aviator multiplier dataset. Here’s how they performed:
| Model | How It Works | Fit Quality | Where It Breaks |
| Exponential | Models decay — higher values get exponentially rarer | Good for 1-10x range | Terrible above 20x (fat tails) |
| Markov Chain | Assumes next multiplier depends on current state | Decent for short sequences | Adds complexity for zero predictive gain |
| Log-Normal | Product of many small random factors | Moderate fit | Parameter-sensitive, hard to interpret |
| Pareto | Models extreme values | Great for 50x+ events | Underestimates medium multipliers |
Verdict: Exponential Is Your Best Bet
For practical purposes — bankroll planning, setting expectations — the exponential distribution offers the best balance of accuracy and simplicity. It’ll tell you that a multiplier above 5x happens roughly once every 20 rounds. That’s useful intel.
But none of these models can predict the next round. They describe the past. The RNG doesn’t care about your model.

What Actually Drives Multiplier Behavior?
Spoiler: almost nothing except the RNG. But here’s what doesn’t influence it:
- Your bet size: Zero correlation. The game doesn’t know how much you wagered.
- Previous round outcomes: Statistically independent. The 1.01x crash 5 rounds ago has no bearing on the next one.
- Player count: Nope. It’s not a shared pot.
- Time of day: The RNG doesn’t have a circadian rhythm.
What does matter: the platform’s specific RNG implementation and house edge settings. Some platforms cap maximum multipliers or tweak the distribution tails. Always check the game’s documentation.
The Hard Limits of Trend Analysis
Let’s get honest about what you can and can’t do with Aviator data:
| Limitation | What It Means |
| Randomness vs. pseudo-randomness | RNGs are deterministic algorithms designed to mimic randomness. Past seeds don’t predict future ones. |
| Sample size bias | 100 rounds produce misleading “patterns.” You need 10,000+ for stable estimates. |
| Overfitting | Complex models (neural networks, anyone?) will find patterns in noise. It’s fake confidence. |
| Gambler’s fallacy | Thinking a high multiplier is “due” after many lows is a cognitive trap — not math. |
An AI that claims to predict Aviator multipliers is either lying or overfitted. Treat every “prediction” as a risk estimate, not a forecast.
Practical Takeaways for Data-Savvy Players
If you’re going to use statistics at the Aviator table, do it right:
1. Know your base rates: 70-80% of rounds end below 3x. Plan your bankroll around that.
2. Rare != impossible: A 50x multiplier happens maybe once in 500-1000 rounds. Don’t bet your stack waiting for it.
3. Distribution over prediction: Use exponential models to estimate probabilities, not to pick the next round.
4. Set real limits: Use historical volatility to set stop-loss and take-profit thresholds.
5. Ignore streaks: They’re random clustering, not divine intervention.
FAQ
Can historical data predict the next multiplier?
No. Each round is statistically independent. Historical data describes what has happened, not what will.
What’s the best model for Aviator multipliers?
Exponential for the 1-10x sweet spot. Pareto if you’re analyzing extreme values. Neither predicts.
How many rounds for reliable analysis?
At minimum 10,000. Smaller samples produce random-looking “patterns” that mislead.
Can AI algorithms give an edge?
Not for prediction. But AI can help with risk management — calculating probabilities, setting bankroll rules, and keeping your emotions out of the equation.